Twitter is currently one of the most widely used social networks — It is a real-time microblogging platform, publicly launched in July 2006. Twitter has one of the biggest data sets in the world. It is much different from Facebook from the aspect that Twitter is real time.
Twitter datasets are awesome troves of information and provide great insights. It provides a platform where businesses and public persons engage with their audiences, important messages are shared in near-real time and, as the recent events show, even politics is done. Today, Twitter boasts of 450M monthly users globally.
Due to the rich data in the pooled tweets, governments, businesses and researchers have understood the power of twitter data.
For instance, think of a way to predict the outcome of an election in a country. Given the fast-paced and concise format of messages shared, it is a nice tool that could be used to gather signals and sentiments that could affect the outcome of an election. These sentiments could be used to understand the mood of the public and their perceptions towards different candidates.
In recent studies, researchers have used twitter data to successfully understand, reach, predict and map violence hotspots during sports events.
In business, Twitter helps brands to understand, track, and benchmark the conversations and perceptions surrounding the brand. In terms of customer engagement it helps directly engage with customers to quickly answer questions, resolve their issues, and provide exceptional service.
Understanding political sentiments
In this series, we’ll look into the process for extracting, transforming and understanding Twitter data relevant to the Kenya 2022 general election. To access the codes refer to this Github repository
To access tweets we developed scripts in Python 3.7, Tweepy and a couple of other libraries. Tweepy is an open-source python package that provides a way for developers to communicate with the Twitter API.
Twitter levies a rate limit on the number of requests made to the Twitter API. To be precise, 900 requests/15 minutes are allowed; Twitter feeds anything above that an error
But first, you will need to obtain the necessary credentials from Twitter. These credentials from Twitter are used to instantiate the API.
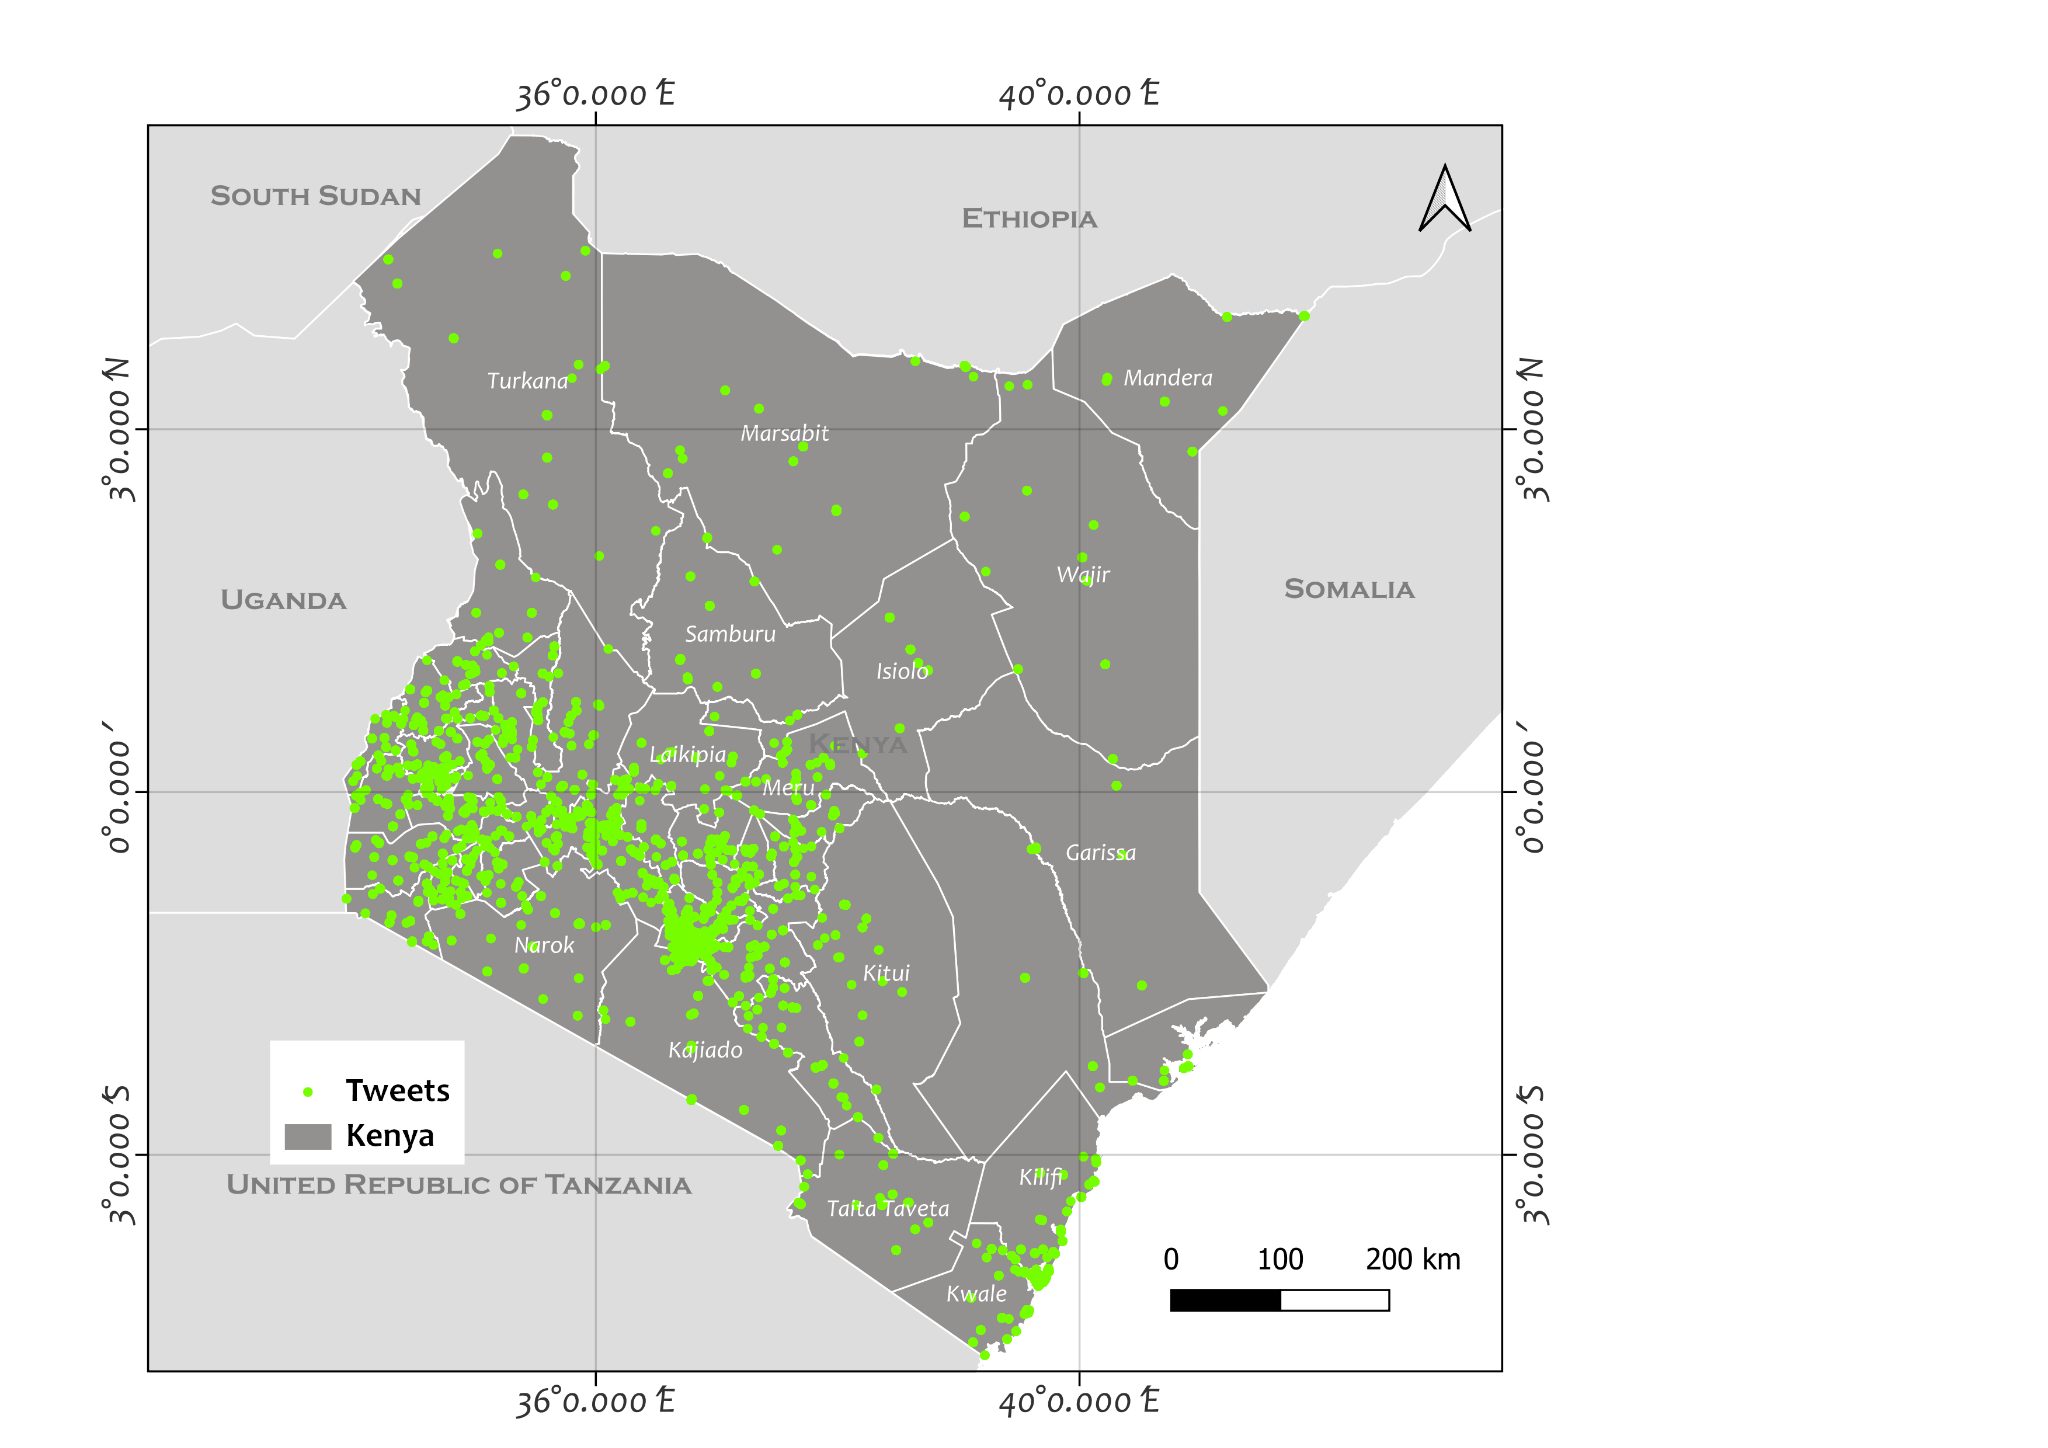
Mapping geographic distribution of tweets
To carry out spatial analysis on the data, it is necessary to add a location component to the individual tweets. This helps in mapping the distribution of tweets as well as classified sentiments. To achieve this, you can use the google maps API or Nominating API to geocode.
Usually the google maps API has a limit of 2500 addresses per day. Nominatim is preferable since it is open and free. Additionally, there is no limit to the number of addresses you can geocode in a day.
Due to the high number of tweets that you can scrap it is advisable to automate the process. The Tidygeocoder package in R which uses the Nominatim API provides an easy and effective approach to automate.
Preliminary results
Below is a map of the distribution of tweets related to the 2022 Kenya general election from May to August of 2022.
Next steps
Through this, I was able to extract over a million tweets related to the 2022 Kenya general Election. These tweets were cleaned, geocoded and mapped. From the geocoded tweets it was possible to determine the number of tweets per county, the dominant candidates in each county as well as the dominant candidates in the country from the sentiments of twitter users.
Next we are going to use machine learning to explore and classify the tweets based on their polarity. From the results we will map electoral related violence hotspots and validate using data from the just concluded election.


